Plot mxFDA object
Usage
# S3 method for mxFDA
plot(x, filter_cols = NULL, ...)
Arguments
- x
object of class
mxFDAto be plotted- filter_cols
column key to filter
- ...
additional paramters including
y,what, andsampleIDto inform whats to be plotted
Details
![[Stable]](figures/lifecycle-stable.svg)
If there are multiple metrics that are included in the derived table, an extra parameter filter_cols
in the format of c(Derived_Column = "Level_to_Filter") will return curves from the Derived_Column
with the level Level_to_Filter
When plotting mFPCA objects, additional arguments level1 and level2 help indicate which FPCA from level 1 and level 2 to plot
Author
Alex Soupir alex.soupir@moffitt.org
Examples
#set seed
set.seed(333)
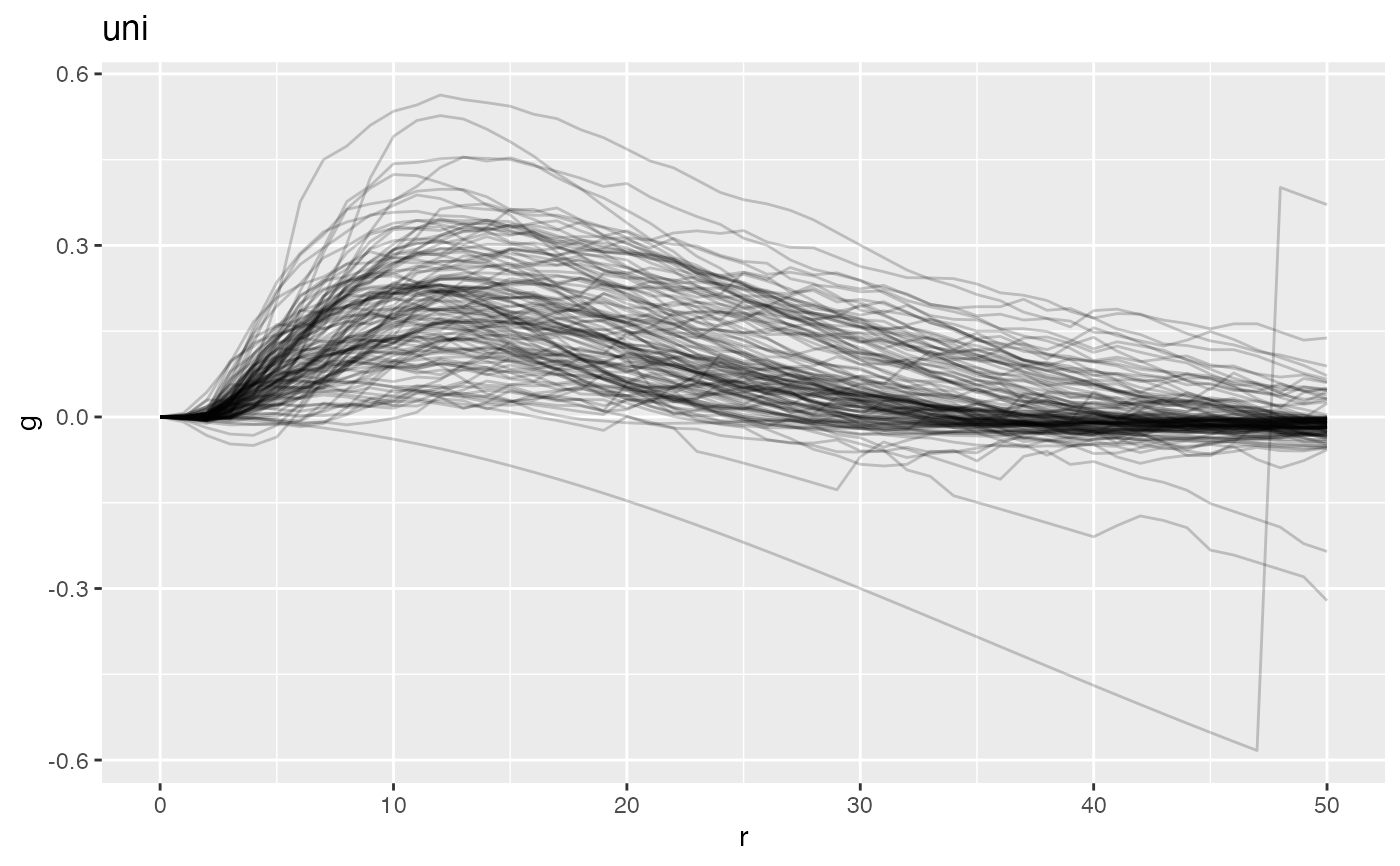
#plotting summary
data("ovarian_FDA")
plot(ovarian_FDA, y = 'fundiff', what = 'uni g')
 #running fpca
ovarian_FDA = run_fpca(ovarian_FDA, metric = "uni g", r = "r", value = "fundiff",
lightweight = TRUE,
pve = .99)
#> 128 sample have >= 4 values for FPCA; removing 0 samples
#plot fpca
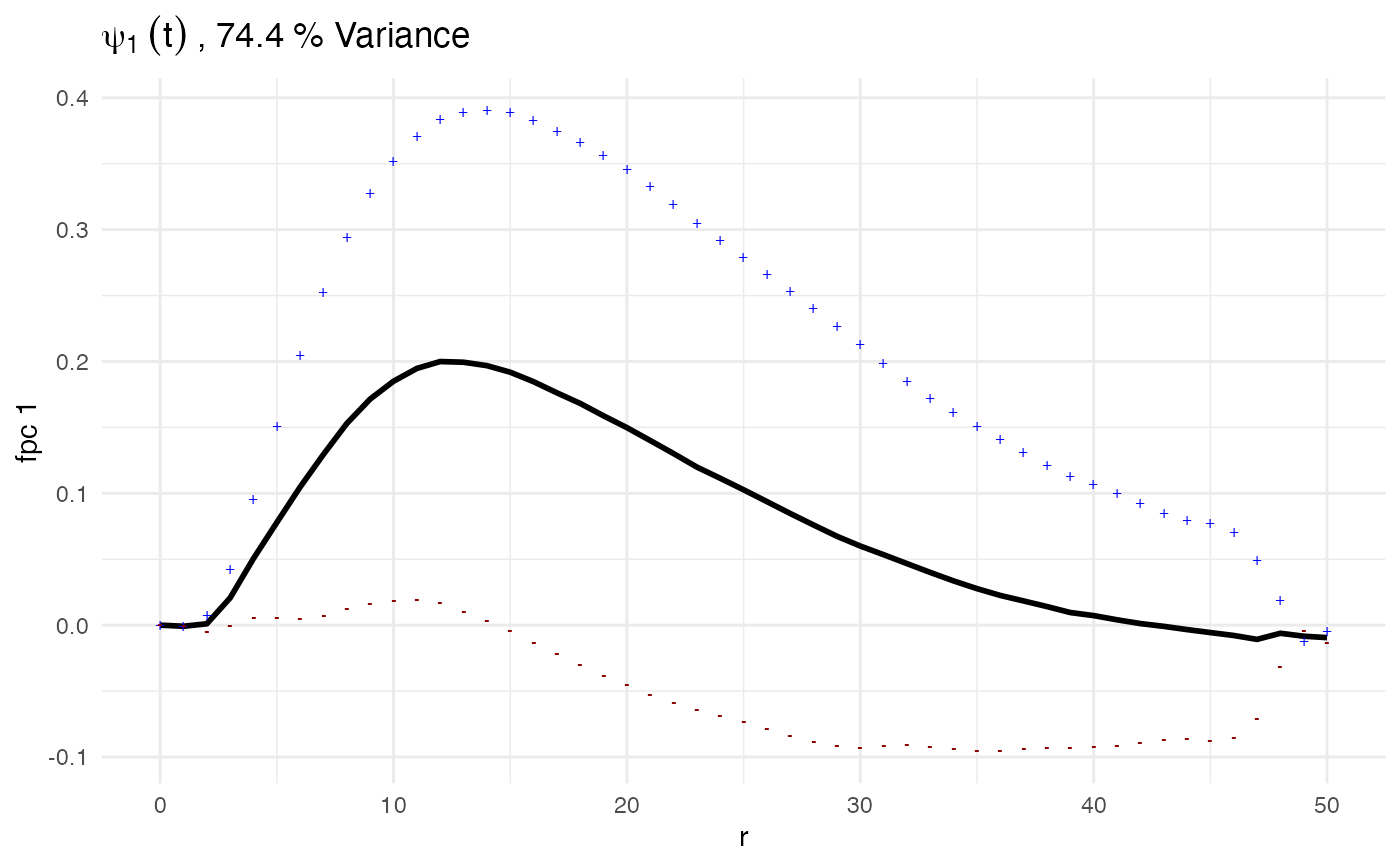
plot(ovarian_FDA, what = 'uni g fpca', pc_choice = 1)
#running fpca
ovarian_FDA = run_fpca(ovarian_FDA, metric = "uni g", r = "r", value = "fundiff",
lightweight = TRUE,
pve = .99)
#> 128 sample have >= 4 values for FPCA; removing 0 samples
#plot fpca
plot(ovarian_FDA, what = 'uni g fpca', pc_choice = 1)